Are we back in 2008?

I have recently seen a number of articles suggesting that 2016 could in fact be a re-run of 2008. In other words a financial storm is brewing but most of us just don’t realise it, or maybe don’t see it yet. As a manager of my own SIPP (Self Invested Pension Plan – a bit like a 401k if US based) it matters to me. It does to you as well although the distance between you and retirement and the distance between you and your ‘managed’ pension plan probably makes it feel somewhat remote.

I started taking a far greater interest in the movements in world markets about ten years ago. With a background in accountancy I have never really been uncomfortable with numbers, and PE ratios, EPS and dividend cover have been familiar concepts for many years. Alas it’s not really enough if you are going to directly control your own financial health, you really need to gain an understanding of the fundamentals of investing and the dynamics of markets, and possible even an insight into technical trading. I have also found it useful to try and better understand the movements of financial markets work and revisit a number of basic economic theories. On this latter point most economists have been trained in the Keynesian paradigm so the views you tend to get are filtered through Keynes economic theory. Our global banking system is also pretty much managed by Keynes followers so if you can get your head around some basic Keynes principles it is far easier to take a guess at the sort of policies they will follow when conditions change.

Central bankers were mentioned deliberately. In recent years it has become obvious that the markets have reacted, Pavlov style, not just to their policies but even to their ‘jawboning’. A newspaper article by Jim Bullard, a US FED president (St. Louis) can move markets. When the US markets react they frequently influence the European markets, sometimes even more than our own indigenous British or European central bankers. In other words there is a fairly tangible link between a US FED member opining on a local US issue and the value of my SIPP. It therefore makes sense to keep an eye on what is taking place outside the UK, in Europe, China, Japan and US.

The theme of this blog is 2016 vs. 2008. ‘History doesn’t repeat itself, but it does rhyme’ as Mark Twain is often purported to have said. This is also true of 2016 in that the US sub-prime derivative catalyst is unlikely to be the source of any problems later this year. In 2008 many of the US banks had miniscule capital ratios and the regulatory framework severely weakened. This is not the case today in that the US banks are far better capitalised, regulation is somewhat improved and the world of MBSs (Mortgage Backed Securities) is far more controlled. I would also like to think that there have been some cultural improvements in the banking system, although that of course we can’t really know until the next crisis emerges.

I do think that we have to look outside the United States for a catalyst. There are many potential candidates ranging from stability in the Eurozone banking system to Japan or China’s lacklustre economic growth story. It could be one or all of these things interacting with each other or perhaps it will be something taking place in the sovereign bond markets or instability in currencies.

Many of the change, transformation or performance improvement projects and programmes I get involved in involve identifying or improving KPIs (Key Performance Indicators) or what I call OPIs (Operational Performance Indicators), the latter being important but not key indicators. I like to apply this analytical framework to economic conditions and the markets as an aid to helping make decisions on what and where to invest.

The markets are not the economy but there is obviously a link between the two. When you get central banks interfering with markets the link is weakened but not eliminated, a good example being the QE (Quantitative Easing) fuelled extended bull cycle the US S&P has experienced until recent months. Irrespective of these interventions the bankers cannot delay the influence of fundamental economic conditions forever, so it’s useful to work through a number of global indicators to get a sense of context.

World GDP (Gross Domestic Product) is obviously a good ‘world KPI’ but it is limited in that it’s a lag indicator. It is a reasonable measure of what happened last year. More useful KPIs are those that track current activity, and two that I occasionally take a look at are the ‘Baltic Dry’ and the global PMIs (Purchase Managers’ Index).

The Baltic Dry provides a sense of world trade which is something of an analogue for global economic activity. It is not entirely reliable on a historical sense in that the boom years of the early 2000s resulted in an increase in shipping tonnage; in other words an increased supply of ships. Nonetheless, despite this distortion acting as a drag on freight pricing the index is trading at historically low levels. At its peak in 2008 the index exceeded 11,500 while today it has struggled to stay above 350.

Notwithstanding additional capacity, there has still been a massive drop in world trade, particularly in East –West import and exports.

The Markit PMI Index tracks PMI in 30 countries. It tracks output, orders prices and employment metrics and is closely watched as an indicator of forthcoming economic conditions. 50 is set as the benchmark with anything above this level suggesting better times ahead while results below indicates potential recessionary conditions. January 2016 data confirms the bear market in basic materials but still suggests that world financials and technology are still in positive territory. However, performance in in consumer services are showing signs of decline, particularly in the US:

https://www.markiteconomics.com/Survey/PressRelease.mvc/dff621d8de6144f189ab901ce430c809

Which brings me to the US. The US is still the largest economy in the world despite the economic assault of China. Whatever happens in the US economy has set the tone for world activity for decades so it’s a good idea to be knowledgeable about what is happening ‘over there’. There have been some improvements in US conditions in last few years, particularly in U3 unemployment numbers and growth. This could be changing. Notwithstanding retail, housing and car sales holding up there clouds are starting to appear on the horizon.

The US dollar may be (very slowly) fading as the premier currency in the world but it still remains the only option as world reserve and the size of its bond markets underpins its role as a safe harbour in a sea of volatile currencies. The enthusiasm for US dollar in the last couple of years can be seen in the DXY, a measure that tracks its performance against a basket of other currencies. The DXY has rocketed from 80 in 2014 to nearly 100 today:

DXY

In other words it has increased in value by almost 25% in a very short space of time. This looks like it may be beneficial to the US but it has a cost. Most of the larger US companies trade overseas and have experienced a drop in earnings as a result of local currency translation into USD. Central banks like to use the currency devaluation tool so the US FED are not likely to be particularly pleased with this situation. Import prices have dropped which means price deflation, another frustration in that the rationale for increasing interest rates is undermined. Long term it’s even worse. US debt is not only heading for $20 trillion but the value of that debt (purchasing power) is not eroding – most central bankers like to increase inflation to 2% or more as a contribution towards reducing its purchasing power. Its nominal value may be increasing but its buying power reduces if you can create ‘healthy’ inflation.

China’s growth is slowly reverting to the lower more ‘normal’ levels experienced by developed economies. It really is too large to generate the double digit growth of the past, especially when the structural impetus is to migrate from a manufacturing into a service based economy. It will be spending less on ghost cities and extravagant infrastructure but there still major initiatives such as the new ‘Silk Road’ which is attracting spend. It needs to eliminate surplus manufacturing capacity but it can’t achieve this overnight, the political risks of a social reaction to industry closures mean that it will take time to restructure.

I don’t really think that the catalyst for the next crisis will be in changing economic conditions, my guess is that it will occur in the markets. Deutche Bank’s $60 trillion derivatives book combined with its low capitalisation rate has recently been cited as a major risk to the European and therefore world banking system. Its president recently had to reassure markets about the robustness of its balance sheet while at the same time going back to the market to raise more capital. Deutche may be a risk but it’s a known risk and doesn’t yet look like the next Lehman. The markets move quickly but it probably deserves a pass at this stage.

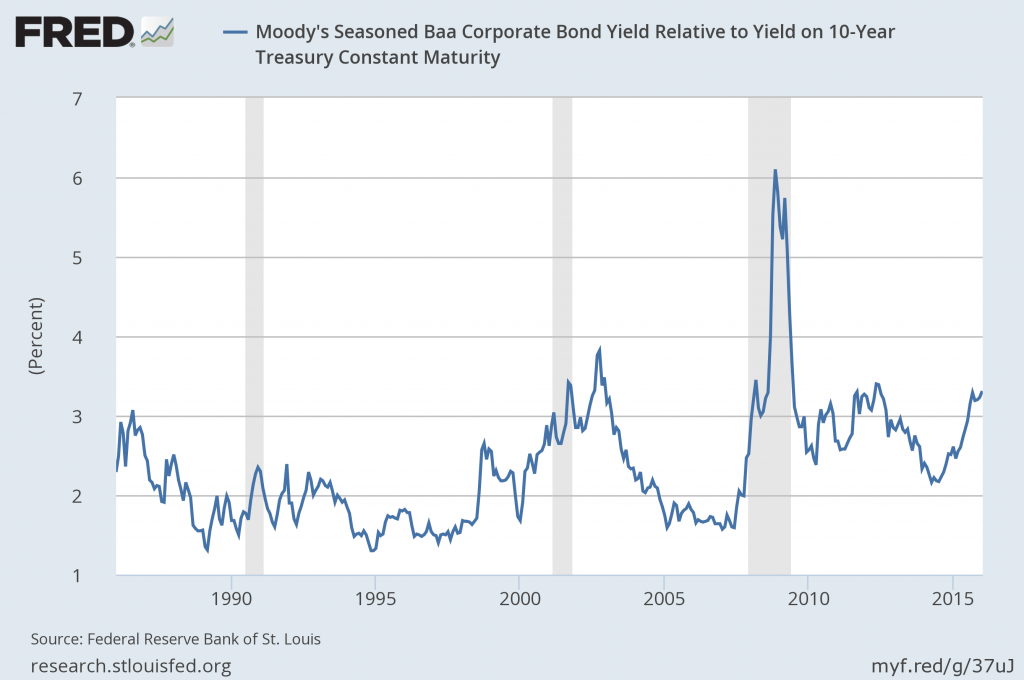
It is the unknown or little publicised risks that are the real concern. Credit spreads, the difference between any bond and a sovereign treasury have widened over the past year. This is a concern. Wider spreads mean growing risk and they are on the rise. We are not yet at 2008 levels but we are close to dotcom bubble levels and seem to be on a clear trajectory upwards. The US FRED charts are a useful tracker, using the benchmark 10 year bond as a reference point:

credit spread

Liquidity is also an issue in the sovereign bond markets in that the central banks have been buying up government debt across the world at an unparalleled rate. Perversely, the policy of central banks buying up sovereign debt and sucking liquidity out of global markets may in fact become a catalyst for a crisis. Japan’s bond market is one to watch with this in mind.

I believe that gold is really a currency despite the PR of the last forty or fifty years. It still trades as a currency pair and is still stored in the vaults of most central banks as part of a country’s currency reserves. In recent years most central banks outside of the West have been buyers of gold, particularly China, whose gold reserves are officially less than 2000 tons but unofficially estimated at anything up to 30,000 tons.
It is not the price of gold that I track as an indicator but the gold/silver ratio. In the past when the gold/silver ratio has got to 80 or more we have had some form of crisis. In 2008 the ratio hit 83, in other words one ounce of gold bought 83 ounces of silver. Panic in the markets drove investors into gold so its value relative to other commodities rapidly increased to crisis levels. Silver is a form of money as well but it also has an industrial aspect and it’s this aspect that manifests itself when crisis conditions are apparent; gold is the behavioural driver of the ratio.

The worrying point at the moment is that the gold/silver ratio is almost at the 2008 peak:

Gold silver ratio

It closed on Friday at 83.04 vs. the 2008 high of 83.86. If it were the only indicator of stress on the credit markets we would already be in a crisis situation. Fortunately, it is not a widely used indicator and is usually reactive to conditions rather than a driver of behaviour. At the moment I see it as a fear indicator, and perhaps the reaction of disaffected currency holders in nations where negative interest rates reign. Gold is often cited as not paying any interest but it’s a far better investment than a bank account in a world where you have to pay a bank to hold your cash.

So, in summary I don’t see an imminent Lehman type moment but there are concerns both in the fundamentals of economic activity and in some of the market indicators.

2016 may not be 2008 just yet but then again we are only two months into the year, and there is that small matter of a Brexit vote which could make things very interesting in May and June. Volatile markets look like a certainty this year, whether or not associated with a true crisis.

The (terrifying?) rise of the robots

I’ve always had an interest in technology, more from the perspective of what it can do for us and what it will mean for us rather than how it works. Back in 1994 I started to get interested in the potential of the Internet and maintained a Compuserve account for a couple of years. The problem was that few other people had even heard of email, never mind actually having an email address. I also started undertaking a bit of personal research and still treasure the October 1994 edition of the ‘Internet’ magazine, the first ever edition and also possibly the first UK magazine devoted to World Wide Web matters. I worked in the cable industry at the time just as it was about to evolve into the cable telecommunications industry. It seemed right to investigate the potential of a technology that could well help change the industry. The potential was always there but few would have predicted just how much of an impact it would eventually have.

So to today, or yesterday, February 23rd 2016. Boston Dynamics, a DARPA funded, Google owned company heavily engaged in developing robot technology released a video on Youtube which depicts how fast the technology is changing.

You really have to see this:

These ‘Atlas’ robots are still slightly awkward in their movements but it is pretty obvious that the wrinkles are slowly but surely being ironed out. Now the military applications are pretty obvious but it also looks like they are also working on commercial applications. Those heavy lifting jobs requiring limited dexterity look like they are now on countdown to being eliminated. I am no expert in the detail but it looks to me like a lot less than ten years before these ‘lifting robots’ are available as ‘off the shelf’ items. Perhaps not as domestic cleaners just yet but even here, once accepted in a commercial environment, we will soon start to see them enter the home.

I continue to read about how fast robots are developing and what they are likely to be doing. It is always good space filling material for news programmes, the middle pages of newspapers and specialist interest groups in the Blogosphere. What there is much less of, is an impact analysis of what happens when it does gain critical mass. How are we going to pay for these robots if the people who might actually buy them have had their jobs displaced by them?

Over time new technologies tend to become an accepted part of our social and economic infrastructure. Despite what could be a fundamentally different change about to be unleashed I am sure that eventually we will be interacting with robots on a daily basis and no doubt consider it an entirely normal and acceptable part of our lives. Though the transition could be painful, more so in that the widespread introduction of robots could take place not over decades but over years.

A general introduction of robots in Western nations will force developing nations to either cut labour costs or adopt the same technology. If we look at the costs of operating in Asia today, China is no longer the low cost manufacturer it once was; look to Vietnam for the lowest labour costs. But even Vietnam will be challenged in competing with a labour force that doesn’t demand higher pay, has low maintenance costs and can work 24/7. We often see the threat of robots as a developed economy issue but in a globalised economic environment it may be that the real impacts will be seen in those nations relying on low labour costs for export muscle.

As nationals of developed nations our concern will be for our own situation. If I’m a shelf stacker and become displaced by a robot what exactly will my future be? Do I retrain, if so to become what? If I can’t find any paid work in my chosen fields, then what? It is quite likely that these are the questions that politicians will be challenged with. How will they react? Will there be robot income tax? Will corporation taxes have to rise to pay for the costs of displaced humans unable to find paid labour? How will pensions be paid for?

Income is obviously high on the list of concerns for any society but it is not the only concern. What exactly are people to do with their time? Is this perhaps the destiny of huge swathes of society? Should we be promoting the education and entertainment sectors far more than today? Perhaps not necessarily as preparation for productive labour but to keep people who would otherwise be employed, occupied. If we adopt this course of action how exactly do we incentivise the people we want to keep on working, the scientists, engineers and medical staff and others who help maintain the fabric of society?

What are the responsibilities of companies and other organisations who plan to introduce robot technologies that displace hundreds of thousands of people? In the past it has been acceptable to simply ‘restructure’ with a redundancy payment and perhaps a bit of outplacement support. This may be far less acceptable in a future where there are simply no human jobs left. A restructuring in this instance really would be the end of the employment road for many people. How should companies adapt their release policies to cater for this new situation? Should expectations be set at the onset of employment? In other words no ‘evergreen’ employment contracts. Should employees be advised far further in advance of their impending release than in the past so that they can prepare? In other words should we be changing our whole attitude to employer – employee relations in a world where ‘robots are our greatest asset’?

When you do start to think about the implications of this technology the questions start to pile-up by the dozen. The worrying part is that there are not many people even thinking about these challenges and even fewer committing pen to paper and suggesting answers. In 1994 the Internet was a single magazine a few thousand basic web pages and a few million email accounts. By 2004 it had taken hold across the developed world and by 2014 virtually all major software applications had been web-enabled and Web had caught the imagination of some of the least developed nations. It’s now everywhere.

Judging by the Boston Dynamics video and some recent statistics I have seen in the growing acceptance of robots I don’t think we will have to wait until 2036 before we see robots everywhere. My guess is that the world of transformation programmes in the 2020s will look somewhat different than those of the last few years. Those skills in project and programme management, Lean Six Sigma, ITIL and other performance improvement initiatives could well become software algorithm re-writes capabilities rather useful certifications for humans. Restructures may well become human organisation elimination rather than a new Visio organogram.

At the moment the government response is to promote software development skills in youngsters going through school. This may work for now but will not be much help when software writing software really takes hold. As libraries of pre-written code are generated and artificial intelligence (AI) start to create algorithms capable of following basic functional requirements the landscape will change again. It’s not HAL that I fear in the world of AI but the more subversive threat of computers removing our ‘thinking’ roles. How then to we prepare our children for work, or non-work as the case may be?

My view is that we need some far bigger thinking than has taken place so far. Robots ad AI will not go away. We need to think through the implications of these technologies before they permeate through our whole social and economic infrastructure. The Internet has created more jobs than it destroyed and perhaps there is an argument that robots and AI will do likewise. However, until we truly analyse and gain a better understanding of their impact we will remain reactive and subject to unpleasant consequences.

After the 2008 banking crisis I often saw comments to the effect that ‘nobody could have seen it coming’. It was totally untrue of course. Similarly, the potential impacts of robot technology and AI are (sporadically) starting to be talked about. Look closely and you can see these robots on the horizon marching towards us.

We have some time to prepare for their arrival but not a lot.

Debt Matters

There are a couple of widgets I have loaded onto a page on my website. One tracks official UK public debt and the other official US public debt. I’m sure there are others I could load, Japan, China and the Eurozone for example, but these are the ones I like to keep an eye on. A few points before getting to the nub of this post. The debt trackers only measure public sector debt, not total debt; the latter including corporate debt and household debt. They also only track what I would term ‘realised’ balance sheet debt. In other words they are not tracking the aggregate future liabilities of social, health and pension commitments i.e. the net present value (NPV) of those liabilities. Add those and we are in 2008 Zimbabwe dollars numbers. I’ll stick to the hard numbers for this blog.

Debt as an absolute number does not really mean much to most people, me included. Economist therefore like to express it as a percentage of gross domestic product (GDP). That helps but is also not particularly useful. GDP doesn’t pay the interest, a country’s tax take does that. The debt to GDP ratio is the most favoured ratio but pretty useless when the exam question is about affordability.

So, to the numbers. The official UK debt now stands at £1.53 trillion and the US $19.06 trillion. Both are increasing at an eye-watering rate per minute. By the time the next US president is elected US debt will have hit $20 trillion with few signs of it getting under control. The US and the UK are in similar situations. Neither country has the means to repay the debt and only manages it on a day by day, week by week basis by revolving loans: new treasuries, gilts and bonds are used to repay older commitments now maturing. Over the past seven or eight years as interest rates have hit near or at zero and it has worked fairly well. The average interest rates on both US and UK has dropped somewhat as new securities have been issued at lower rates.

Alas in the UK’s case interest payments alone are now in the region of £50 billion a year. To put in into context total UK tax take is about £650 billion which means that 7.5% – 8% of our taxes are wiped out by interest payments (about 6% of the US budget is absorbed by interest). The fact that in both the UK and the US total interest payments have been flat over the past few years is the perverse result of interest levels being at the lowest levels since the Black Death. Interest rates rising from their current suppressed levels of 0 – 0.5% to more ‘normal’ levels of 3.5% – 5% will raise interest payments in the tens of billions in the UK and hundreds of billions dollars in the US – analysts estimate that each 1% upward movement in US interest rates translates into an additional $200bn in payments to external creditors.

In a growing economy, taxes will increase to service payments of existing debt. Growing economies also usually deliver price inflation which erodes the ‘value’ of the nominal aggregate debt accumulated over time. Debt commitments are therefore usually affordable.

However, the problem we currently have is that economic growth is not really reaching levels that is making much of an impact. The existing paradigm of over -supply of commodities, goods and services across the globe has created a price deflationary environment, discouraging new business start-ups. The money created by central banks found its way into the equity markets, recapitalised some of the banking system or has simply sat on central banks’ balance sheets. In the US FED’s case something in the order of $2.3 trillion still sits on its balance sheet as the ‘excess reserves’ of the commercial banking system. Commercial banks have been less willing to take risks and lend and entrepreneurs have been unwilling to borrow. What is the point when there is already over supply everywhere?

Having burrowed about as far as I want to into the background of public sector debt I think it’s time to surface and get to the purpose of the post. Despite the ominously financial/economic sense these initial paragraphs have conveyed, this is really a blog about change.

Our public sector debts matter. The cumulative effect of all the debt across the western world in my view has been impacting the micro-change management world for the past few years. Debts have to be serviced. Public sector debts are serviced by raising taxes or cutting public expenditure. Both approaches have economic and financial consequences. Organisations and businesses have to react to these changes.

If public sector expenditure falls, the companies relying on the revenues from public organisations need to adjust their behaviours and costs if profitability is to be protected. Falls in public sector expenditure represent a change in market conditions and it is not hard to make the case that recent changes are more structural rather than cyclical in nature.
Increases in taxation take income out of corporate and consumer pockets, income that might otherwise be applied to commercial and domestic expenditure. The theory is that taxes are just a reallocation of expenditure rather than a loss to the economy: the government can spend your money better than you can. Well, there may be some substance to this if taxes are reallocated to public infrastructure spending but the argument fails miserably when your taxes are taken just to service existing debt. This latter argument also compounds if and when interest rates go up (2020 now!) and we have a £2 trillion debt and interest rates at 3.5%. If that unpleasant prospect coalesces in our none-too-distant future it has the potential to deliver massive change management challenges for both the public and private sector. Gross UK taxes are already around 38%, the point at which economists and Treasury officials start to think about what a UK ‘Laffer Curve’ might look like. Laffer is all about the point at which increasing taxes impacts behaviours, and there is a point at which people lose interest in working. Thus, somewhere in the 40% range it is postulated that increasing taxes actually reduces total tax take.

So the real point about the blog is that debt really does matter. My own contention is that the relationship between debt levels and change management is far more tangible than it ever has been, primarily due to the enormous size of those public sector debts. Low interest rates have bought us some time but companies and public sector organisations really ought to be preparing now for the effects of these debts rather than wait for governments to effect tax increasing and spending reduction panic measures a few years from today. After eight years of emergency central bank measures we are no further forward. Even the hardened ‘cycle’ economists are starting to doubt. Equity markets have been buoyed by central bank largesse but the underlying economic conditions across both sides of the pond look more and more like structural changes are underway.

As I look at the world the big economic issues transmit into change management challenges almost immediately. In response to the banking crisis, the US FED created free money via quantitative easing (QE). Free money was thrown by the hundreds of $billions at US shale which promoted rapid technology development and in turn turbo-charged on-shore non-conventional oil production. In only a handful of years the US emerged to challenge Saudi Arabia as the biggest producer, taking tangible market share from OPEC countries. OPEC reacted by artificially increasing production to maximum output, which has hit Crude and Brent spot prices. Spot prices rapidly fell which created massive problems for the oil sector across the world. Companies have had to react quickly to an industry in financial distress. Dozens of organisations have created change programmes to address the revenue and cost problem – change management specialists with deep energy sector experience are at a premium at the moment.

Again, the point here is that big economic issues translate into organisation level change management challenges very quickly. And the ‘big daddy’ of these issues is almost certainly the level of public sector debt in western countries. When the cracks do finally appear in the current Ponzi like approach to servicing debt, it will likely affect every sector, not just one or two. All organisations and companies will be confronted by the challenge of how governments will react. Some strategic thinking and scenario planning may well be called for.

It would be nice to think that a crisis will never happen but hope has never really been much of a strategy in the past. Central banks have managed to suppress interest rates and put government debt on their own balance sheets for some years now (both the US FED and BoE own 35% – 40% of their respective governments’ debt) but at some point the jig will be up. We don’t know what the catalyst for a crisis will be but tangible signs of recession will be a promising candidate – recessions increase deficits and push public debt up at an even faster rate. Reactions to a crisis could involve printing yet more money or negative interest rates but these policies have not worked very well in the past and future effects could be even more muted.

So I’m going to continue to keep an eye on those debt trackers, despite the sceptics who see everything still working and have concluded that the financial and economic system must therefore be just fine.

For my part, debt matters.

The evolving shared service centre

I tripped into the world of shared service centres (SSCs) by accident.

The revolution in telecommunications, media and technology (TMT) during the 1990s did not appear without cost. Valuations for TMT companies accelerated at warp speed from the early part of the decade right into a brick wall during the year 2000, but that’s really for another blog. The reason for the reference is really a contextual point for the sort of environment it fostered. Mergers and acquisitions (M&A) during the ‘90s took place at ever increasing valuations, and apparently at escalating costs. Companies started and continued to borrow for this activity, not at IG (Investment Grade) rates but HY (High Yield), or ‘junk’ rates. Interest rates on amounts borrowed for infrastructure investment and M&A exceeded double digits well before the end of the decade.

So what has this got to do with shared service centres?
Well the link may appear tenuous but it was far more direct than most would realise. M&A activity created opportunities for eliminating cost through removing duplication and those enormous interest payments had to be serviced. The industry needed some new ideas for saving operational costs, and quickly.

Centralisation as a concept had been around for many years before the appearance of shared service centres but the traditional approach was rather one-dimensional. In most instances it was simply a case of consolidating lots of people previously working on a dispersed basis into a single physical site. It was far less about efficiency and effectiveness than about visible control, and they were certainly not in the business of customer service. Likewise the concept of identifying critically important performance indicators had yet to evolve into an operating process standard.

With a clear need to save costs it was down to the ingenuity and creativity of the industry to develop practical ways of making it happen. Centralisation was agreed as the obvious place to start but the traditional model would not be enough. We were fortunate in that the tectonic shifts in the telecommunications industry were being matched by similar changes in information technology (IT). Developments in IT started to open doors to improving how transactions could be effected. Thus the concept of ‘Automation’ emerged as something very relevant to providing service vs. its usual application in the manufacture of goods. For my part I usually associate automation with ‘Standardisation’, the challenge of ensuring that tasks are undertaken on a consistent basis. Centralisation, automation and standardisation initially looked like the way forward and for a short time all the emphasis was placed in this direction.

But the really big change wasn’t technical or structural, it was cultural. Instead of just ‘doing stuff’ the concept of service, of ‘customer service’, was introduced. I worked in a sales environment at the time and the sales guys were measured daily on their performance. Our relationship was direct. The output of our sales operations had an immediate impact on the performance of the sales teams. The company expected Sales to deliver so why shouldn’t we be expected to deliver on a similar basis? Reports on our own performance as well as that of our ‘internal customers’ were developed, Key Performance Indicators (KPIs), not just on cost but on the services we provided. A standard operating environment (SOE) was developed with the sales line management which outlined how sales advisors would work, what reports they would receive, when, and generally what was expected of them. For the sales people to succeed we had also to deliver. A service level agreement (SLA) emerged. We agreed the types of reports that would be produced, at what time of day they would be produced by, and to whom they would be distributed. Commitments were made on how quickly the daily sales orders would be distributed and the time it would take to process orders through the ‘stages’ in the customer relationship management (CRM) system. End to end (E2E) process thinking became the norm with initial targets soon becoming performance standards.

Thus the shared service centre emerged. It wasn’t a tried and tested, well-trodden route to an optimised cost structure providing high quality services, but a pragmatic reaction to a requirement to reduce costs very quickly. It worked through the innovative efforts of our people in developing pioneering solutions, a commitment to teamwork, sound leadership and a recognition that fundamentally we all wanted to grow the business.

So what of the 21st Century shared service centre?
The concepts are basically the same as are the critical success factors. There is perhaps a slightly greater emphasis on the people aspect but the core elements developed in the 90s are pretty much the same. My own criteria for assessing a shared service centre involves taking a look at a number of aspects of its operation:

Cost effectiveness

Has it been structured in the most cost effective manner? This could take us into the realms of physical locations and virtually centralised operations as well as organisational structure.

Are processes optimised? Are they written down? Is there a process owner? Is there a continuous improvement culture? Shared service centres are established to process transactions and the processes used should be constantly reviewed for environmental changes and other improvement opportunities. Inferior processes equate to higher transaction unit costs and ultimately to competitive disadvantage.

Are processes optimised the extent where only increased automation can deliver additional benefit? Automation is a cost as well as a benefit so its contribution should be assessed in the context of its cost.

Effective planning, both for resources and tasks for the day, week, month and year is another essential ingredient in running a cost effective SSC. Poor planning will mean more cost. The SSC needs to have the right resources available at the right time to deliver to the committed SLAs. Costs are not just financial when things go wrong.

Customer service culture

Has the concept of delivering a service been embedded into the operation? Do the people within the service centre think in terms of delivering services to their internal customers, or is it just an administration job?

My firm belief is that you will never deliver excellence in a shared service centre unless the people operating it believe in service, and their part in contributing towards excellent external customer service. This means measuring your own performance, accurately and with integrity, and managing to the internal SLAs you have committed to.

It should also be remembered that it is a ‘shared’ service centre. There should not be preferential treatment to some functions at the expense of others. Agreements may be made within the context of a broader SLA from time to time, but they should be transparent and fair.

Most SSCs use individual financial incentives as a method of supporting the service goals of the organisation. These certainly underpin the importance of providing service but they ought to be carefully designed so that the cost aspects are not undermined and that there are no other ‘hidden’ costs relating to staff.

Customer service feedback is also important. KPIs may provide one communication route but opportunities to use response surveys and user groups should also be sought.

People

A third theme is around the people operating the shared service centre. Today’s centres can be substantial in size and the work repetitive. Consideration needs to be made of the training and career development needs of staff and work ought to be rotated. Teamwork is essential, not just within the SSC but with the functions and people supported. Teamwork will help foster ownership which itself helps promote customer service.

As with other functions the roles and responsibilities of people working within the SSC should be constantly evaluated and adjusted if necessary. The demands on an SSC will evolve over time and with those demands so will the processes and the roles played by individual line managers and staff.

Shared service centres evolved through internally centralising transactional environments. They have now moved externally and in some cases offshore. The emergence of external solutions has introduced a whole host of other sourcing related issues encompassing pricing, contracts, cultures, languages and time zones. The challenges of control, intellectual property and core strategy and also not too far away. Shared service centres are now not just about how they are run but who should run them, where and for what cost.

Looking beyond the present there is a significant chance that the functional tasks of the SSC will become further automated. There are already signs that Robotic Process Automation (RPA) will make significant steps over the next decade into replacing people processing tasks with automated hand-offs. It is not beyond possibility that the SSC of 2030 will look more like a server in an air conditioned IT room than an office in India processing transactions for a European bank. As past experience has often informed: if it can be automated then it most likely will be automated.

It has taken fifteen to twenty years for the modern SSC to evolve to where it is today. The next ten to fifteen could well introduce changes that are even more dramatic and possibly even lead to its elimination as a management concept.

Global oil demand, supply and prices

It’s been almost enjoyable fuelling-up the car over the past few months. Prices have been dropping saving 25 – 30% on what I had been paying eighteen months ago. I live somewhat off the beaten track which means I don’t have access to gas supplies; oil central heating has been the only option. Filling up the oil tank has been much more satisfying. Heating oil doesn’t suffer the same taxation regime as transport fuel which mean that the lowered costs of barrels of oil (‘bbls’) have been far more noticeable. Combined with a milder, though wetter, winter than usual my current account is far healthier than it would normally be for this time of year.

The problem is that it doesn’t feel real. As with most of the developed world we have been inculcated with the notion that consumer prices should go and that 2% inflation is good for us. Creating 2% inflation has become a primary objective of most central banks; even the U.S. Federal Reserve joined that party a couple of years ago.

So what exactly is going on with oil prices?

There are several versions of history relayed by the media on this but they seem to distil into two broad themes. The first is one of supply, demand and price and the other relates to global politics.

The $140 price reached around the time of the 2007/8 banking crisis set the scene for more production but it was the reaction to that crisis that really acted as the catalyst for today’s low prices. The U.S. Fed printed money, QE (Quantitative Easing), and lowered interest rates to near Zero. The hundreds of $billions of ‘free money’ found its way into the U.S. energy sector coincidental with an accelerated development of ‘fracking’ technology. High oil prices encouraged lenders to pump money into the sector and produce. And produce they did. U.S. ‘tight oil’ or shale oil rocketed from a few hundred thousand bopd (barrels oil per day) of production in 2008 to well over 4m bopd by late 2014. You can see how this production turbocharged overall US crude production in the statistics here:

https://www.eia.gov/petroleum/production/

It peaked in spring 2015, also reflected in the statistics.

The nexus of politics and economics converge in the market reaction to this increase in U.S. production. OPEC saw this as a threat and Saudi Arabia are the biggest player in OPEC. Allegedly, the Saudis felt that ‘their’ market share was under attack and responded by increasing output to maximum with a view to influencing the price downwards and undermining the economics of U.S. shale production. It also had the added benefit of a poke in the eye of the Russians, also a major threat to Saudi production dominance. It worked. When combined with a recession in global activity in the Asia-Pacific markets a ‘glut’ emerged which naturally had a big effect on price.

Shale economics are complex. You don’t switch off a producing well overnight, even at prices well below profitable levels. And there is also the question of paying interest on those humungous debts accumulated during the ‘go-go’ years of shale expansion. ‘Hedging’ (selling forward) is also common in commodity markets and the shale producers had substantially hedged their output at contract prices extant prior to the price crash. Thus in 2015 while spot prices had plummeted many shale producers had been protected by their 2014 hedging contracts.

It’s getting complicated. My cheap petrol and heating oil seems to be tied-in with what will happen to the shale producers in 2016 and when the Saudis decide to reduce output.

On the former, it looks like only about 15% of shale production is hedged in 2016.

http://www.worldoil.com/news/2016/01/30/oil-and-gas-companies-face-difficult-year-as-hedging-protections-roll-off-ihs

Shale wells also deplete rapidly and the U.S. Fed is not as ‘accommodative’ as it has been in throwing ‘free’ money about. It does indeed look like U.S. oil production is going to fall somewhat in 2016, at least according to the EIA. The EIA has a rather optimistic outlook suggesting that overall output will drop from an average of 9.43m bopd in 2015 to 8.73m bopd in 2016 and 8.46 bopd in 2017. I suspect that the fall will be far more dramatic when you start to factor in the depletion rates for shale oil wells and an expected tranche of energy company bankruptcies during the course of the year.

Offsetting U.S. shale oil is Iran’s expected output. I have seen media comments projecting that Iran will add another 1m bopd over the course of the next year although traditionally the more experienced oil analysts have indicated that it will be more likely in the 200,000 to 400,00 bopd area. Let’s take the higher number. If this is the case the net effect of U.S. production decrease and an Iranian increase is still a decline of 300,000 bopd.

The last official world oil production statistic in the public domain is 96.2m bopd, the June 2015 figure also published by the EIA:
https://www.eia.gov/cfapps/ipdbproject/IEDIndex3.cfm?tid=50&pid=53&aid=1

Switching over to demand, the IEA (International Energy Agency) suggests that Q1 2016 demand will be 94.69 bopd, so the difference between world production and consumption is probably about 1.5m bopd.

But what is really interesting is that the Q3 and Q4 2016 IEA projections indicate that the demand will increase to 96.4m. In other words that wafer thin margin or ‘glut’ will evaporate during the course of the next six months, and we may even end up with a supply deficit.

My own view is that the decline will be greater and probably a little quicker than the forecasts suggests. We can’t guarantee that Iran will deliver 400,000 bopd nor can we guarantee that the Saudis will persist in maintaining maximum production. It’s not beyond the realms of possibility that oil prices will increase rather dramatically during the middle of the year and catch a lot of people by surprise. Anything is possible in our now highly interconnected world.

I think I’ll be filling that oil tank up long before winter this year.